0
Multiplying a function by -1 will make it a reflection of the original function across the x axis.
What else can I help you with?
Graph of an inverse proportion is an?
The graph of the function y(x) = 1/x is a hyperbola.
What happens to the graph of a function when you replace x with ax?
When you replace ( x ) with ( ax ) in the function ( f(x) ), the graph of the function undergoes a horizontal scaling. If ( a > 1 ), the graph compresses towards the y-axis; if ( 0 < a < 1 ), the graph stretches away from the y-axis. The overall shape of the graph remains the same, but the x-coordinates of all points on the graph change according to the factor ( a ).
What is y equals 3x?
I don't understand your question but y=3x is the function of a graph, to graph the function you would plug points into the function such as x=0, x=1, x=-1 and you would find the y values at each point so that you can graph it. In this case the graph is a parabola which has a u shape.
What happen to the graph of a function when you multiply the function rule by a?
If a > 0, it is stretched, in the vertical direction, by the factor a If a = 1 it is unchanged If 0 < a < 1, it is shrunk bt the factor a If a = 0, it is coincident with the x-axis If a < 0 then as above, but it is also reflected about the x-axis (turned upside down).
How can you graph a linear function without a calculator?
y=x+1
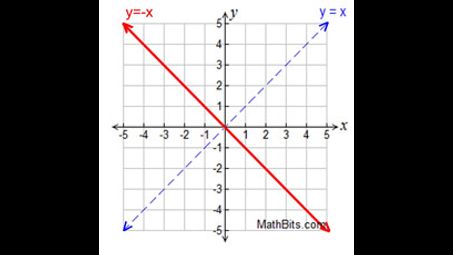
What is the effect on a graph when you multiply a function by -1?
When a function is multiplied by -1 its graph is reflected in the x-axis.
Which operation flips the graph of a function over the x-axis?
Multiply by -1
If the parents function is y4x which is the function of the graph?
The function y = x is the graph that passes from the points (-1, -1), (0, 0), and (1, 1) The function y = 4x is the graph that passes form the points (-1, -4), (0, 0), and (1, 4) Sketch these graphs in a same x and y coordinate system, and you can see both of them
Graph of an inverse proportion is an?
The graph of the function y(x) = 1/x is a hyperbola.
Explain how the graph of fx ln x be used to graph the function gx ex -1?
graph gx is the reflection of graph fx and then transformed 1 unit down
What happens to the graph of a function when you replace x with ax?
When you replace ( x ) with ( ax ) in the function ( f(x) ), the graph of the function undergoes a horizontal scaling. If ( a > 1 ), the graph compresses towards the y-axis; if ( 0 < a < 1 ), the graph stretches away from the y-axis. The overall shape of the graph remains the same, but the x-coordinates of all points on the graph change according to the factor ( a ).
What is y equals 3x?
I don't understand your question but y=3x is the function of a graph, to graph the function you would plug points into the function such as x=0, x=1, x=-1 and you would find the y values at each point so that you can graph it. In this case the graph is a parabola which has a u shape.
What happen to the graph of a function when you multiply the function rule by a?
If a > 0, it is stretched, in the vertical direction, by the factor a If a = 1 it is unchanged If 0 < a < 1, it is shrunk bt the factor a If a = 0, it is coincident with the x-axis If a < 0 then as above, but it is also reflected about the x-axis (turned upside down).
What happens to the graph when the function is multiplied by a number greater than 1?
When a function is multiplied by a number greater than 1, the graph of the function is vertically stretched. This means that all the y-values of the function are increased, making the graph rise more steeply compared to the original. Consequently, points on the graph move away from the x-axis, resulting in a steeper appearance without changing the x-intercepts.
What is the area bounded by the graph of the function fx equals 1 - e to the power of -x over the interval -1 2?
What is the area bounded by the graph of the function f(x)=1-e^-x over the interval [-1, 2]?
What line test is used to determine if a graph is a 1-1 function?
2
How can you graph a linear function without a calculator?
y=x+1